Charts · Benchmark Section
Your Product vs Theirs, in Bars.
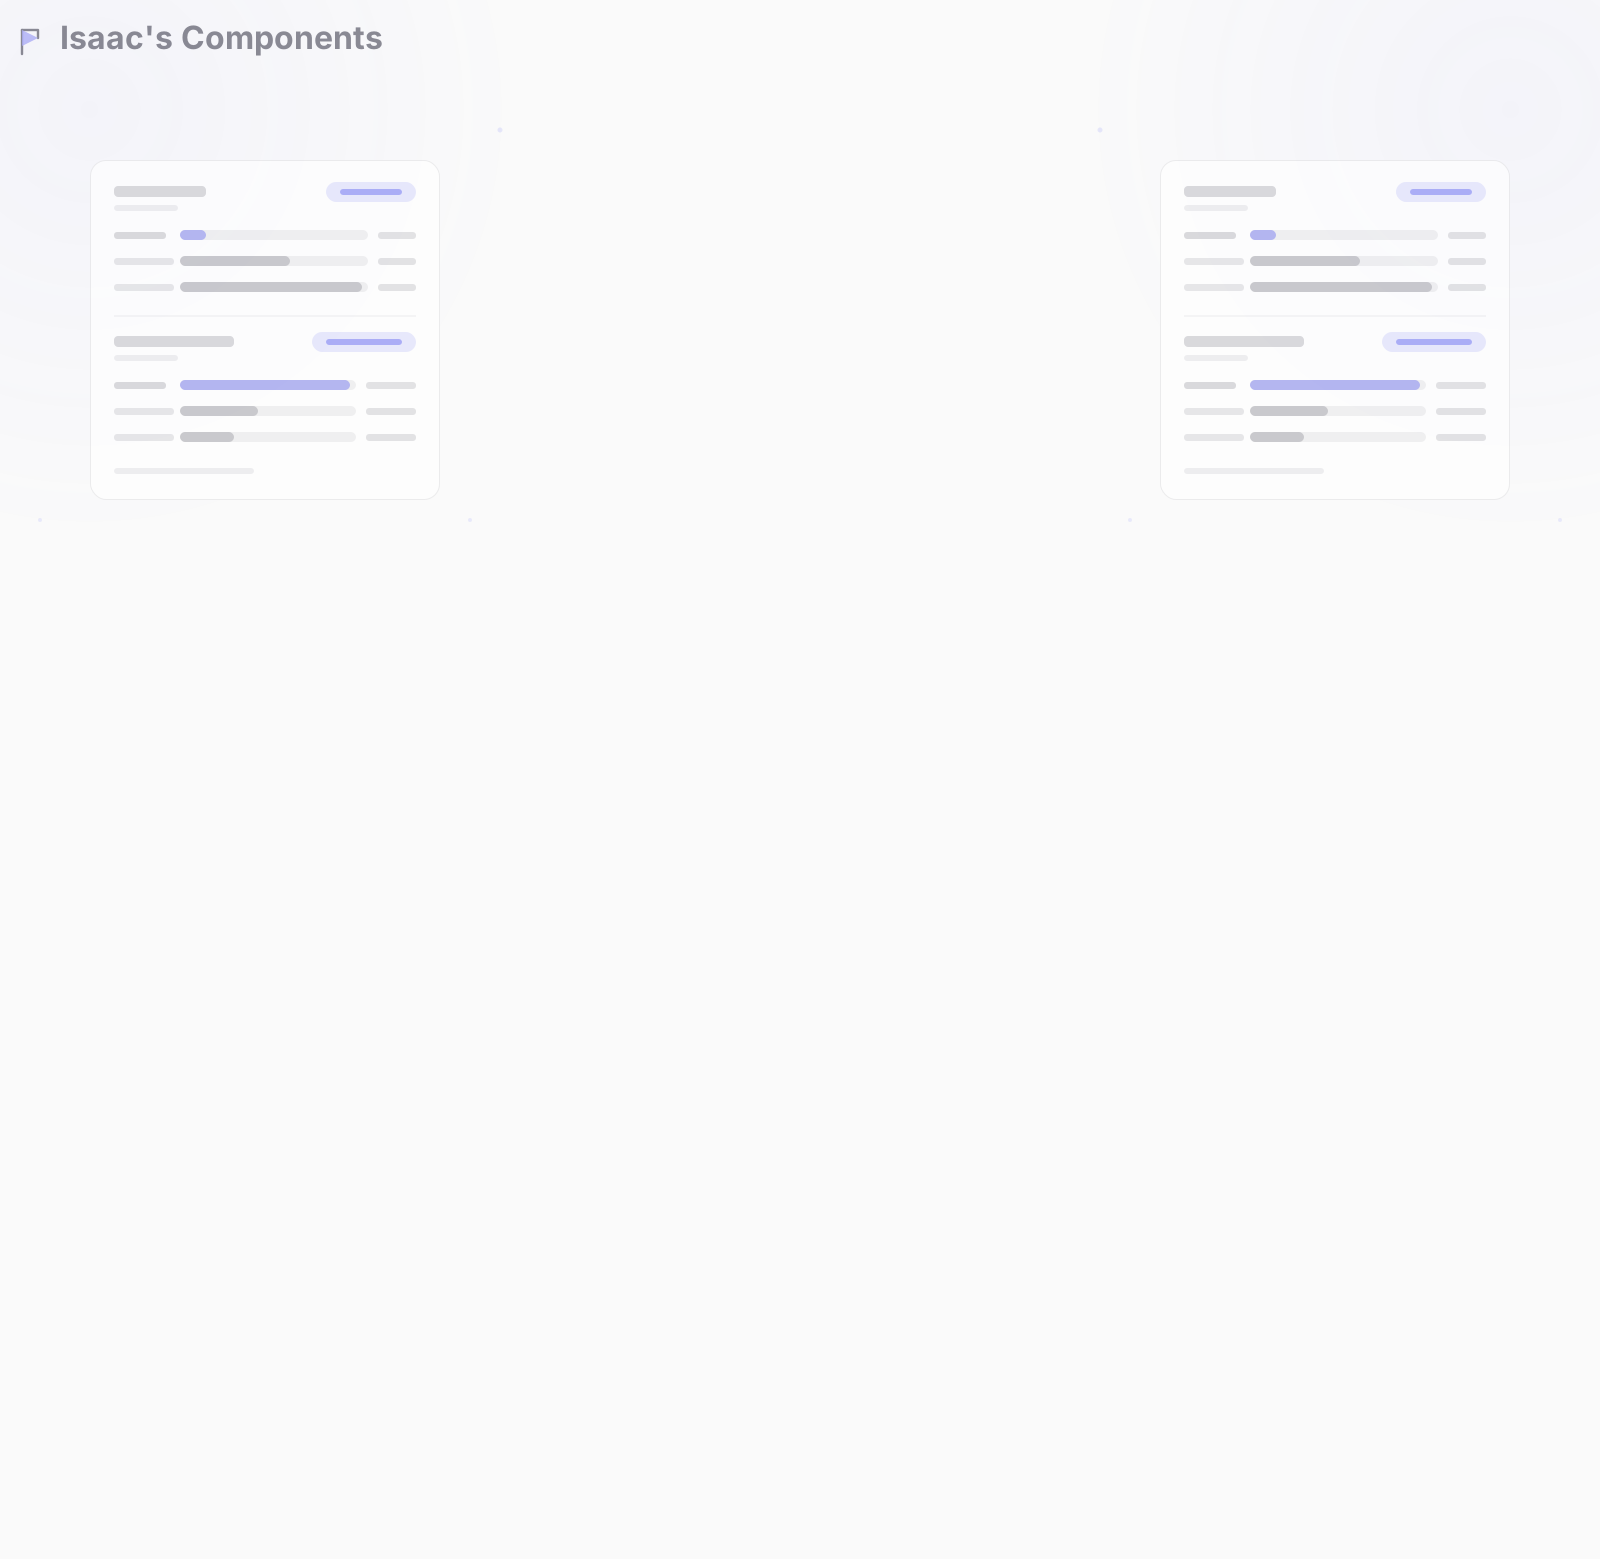
Your measured numbers next to the alternatives, your row highlighted, and the ratio badge worked out for you — the benchmark block dev-tool and AI landings hand-code, as one section. No CMS, no code.
Horizontal bars per metric, your row highlighted, a ratio badge computed from the numbers — lower or higher is better
Source footnote with a link, scroll-in growth and count-up that respect reduced motion, list or two-column layout
Zero external libraries, zero layout shift — pure React and CSS
Benchmarks
Measured, not marketed.
The same workload on every tool, on the same machine. Every number below comes from the setup in the footnote.
Cold start
Lower is better
- 0 ms
- 0 ms
- 0 ms
p50, cold container, 20 runs
Bundle size
Lower is better
- 0 KB
- 0 KB
- 0 KB
gzipped, production build
Requests per second
Higher is better
- 0 req/s
- 0 req/s
- 0 req/s
single instance, 64 concurrent connections